
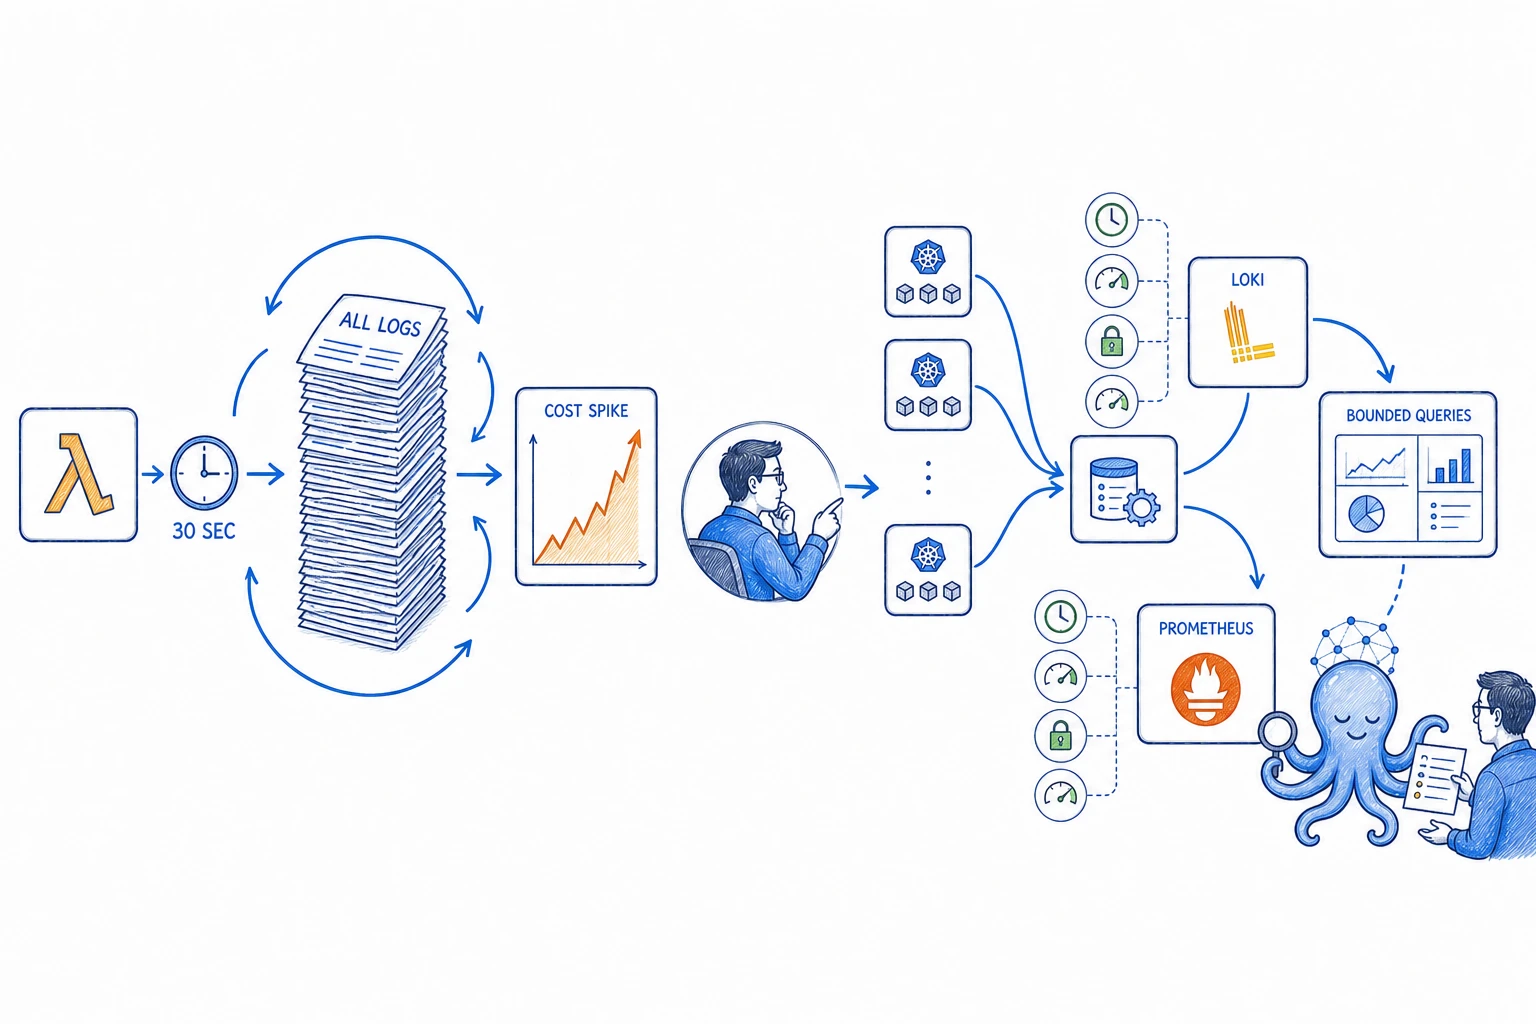
A small Lambda function scanned every CloudWatch log it could access every 30 seconds. Over a weekend, the usage added the equivalent of about 12 normal months of AWS spend. The code was easy to understand. Its financial behaviour was hidden across several AWS services.
The function had been created to collect logs for further analysis. Across one weekend, its schedule produced about 5,760 runs against the full log estate. The Lambda execution cost was insignificant compared with the repeated work behind each execution.
Cloud billing feedback did not arrive at the same speed as the workload. The increase became visible after the weekend, once the same request had already run thousands of times.
This pattern is easy to underestimate. The source code shows a small scheduled Lambda. It does not show the volume behind its permissions or the cost of every downstream operation. The financial behaviour only becomes clear when schedule, data scope, usage pricing and billing delay are reviewed together.
We later moved monitoring to a stack with explicit collection, storage and retention limits. That change reduced recurring AWS spend and gave engineers and AI tools a more controlled way to query operational data.
CloudWatch followed the request
A reasonable automation created an unbounded usage pattern.
The function had a reasonable objective. It needed operational data, and CloudWatch was where that data lived. A scheduled Lambda was a familiar AWS pattern. Each individual run looked harmless.
The danger appeared when the function could read every log group, each run covered far more data than it needed and the schedule repeated that work every 30 seconds without a cost or usage limit.
CloudWatch charges for separate activities such as log ingestion, storage and some forms of analysis. The exact bill depends on the API, region and data path. With CloudWatch Logs Insights, for example, the amount of data scanned matters. AWS recommends selecting only the required log groups and using the narrowest possible time range.
A developer can understand Lambda, IAM and CloudWatch separately and still miss the total cost path. No single file shows the schedule, accessible data volume, downstream usage price and billing delay together.
The system repeatedly asked a very broad question. The code received valid results while the financial effect stayed outside its normal feedback loop.
Every 30 seconds
A scheduled mistake becomes part of the platform.
At a 30-second interval, a function runs 120 times per hour and 2,880 times per day. Over two days, that creates 5,760 opportunities to repeat the same expensive behaviour.
This is why code review alone is a weak cost control. The schedule expression is easy to understand, and the cost of one Lambda execution may be tiny. The total depends on log volume, access scope, query windows, overlapping reads, retry behaviour and the CloudWatch operation used.
AI increases the importance of this boundary. An agent can generate a query, inspect the result and try again much faster than a person. That speed is useful during an incident. Without limits, it can repeat an inefficient investigation thousands of times.
A cheap scheduler can trigger expensive work elsewhere in the system.
- 01Scheduled Lambda
The trigger runs every 30 seconds throughout the weekend.
- 02Broad identity
The function can reach every CloudWatch log group in scope.
- 03Large read
Each run asks for far more history and data than the next decision needs.
- 04Repeated work
Overlapping reads process the same log estate again.
- 05No local limit
The workflow has no daily usage budget or automatic stop condition.
- 06Delayed discovery
The team sees the financial result after the weekend.
Billing alerts are the backstop
Put limits close to the job that creates the cost.
The workload operated on a 30-second schedule while financial feedback followed the cloud billing cadence. By the time the change was visible, thousands of valid requests had completed.
Budgets and anomaly monitoring should be routed to people who can act. A service-level budget is useful because an account-wide monthly threshold can react late or hide a sudden increase inside a larger bill.
AWS Budgets and Cost Anomaly Detection still depend on billing data that arrives later. AWS notes that budget notifications can be delayed. Cost Anomaly Detection uses Cost Explorer data, which can take up to 24 hours to arrive. Billing alerts provide an important backstop, while the execution path needs faster limits.
- Allow named log groups instead of every log group.
- Use a narrow time window and keep a checkpoint for incremental reads.
- Limit query frequency, concurrency, runtime, retries and returned results.
- Record usage for each automated monitoring workload.
- Route abnormal-usage and failure alerts to a named owner.
- Provide a kill switch that does not depend on editing and redeploying the job.
Own the data path
Move collection, retention and query limits into reviewable configuration.
For this client, the better long-term option was a monitoring stack running within infrastructure we could size and control. It uses Prometheus and Thanos for metrics, Loki for logs, Alloy for collection, Grafana for dashboards and Alertmanager for notifications.
Helm and Argo CD keep retention, storage, resource limits, alerts and access in reviewable configuration. Alloy collects selected workload logs and sends them to Loki. Prometheus collects known metrics from declared targets. Grafana queries the existing data stores instead of starting a fresh export of the whole estate on a schedule.
Our standard configuration gives Loki a seven-day retention and query window. Prometheus has time and size retention limits. Each cluster can keep its own data while a shared Grafana reads remote data sources through authenticated endpoints.
Running this stack still consumes compute, memory, storage and engineering time. Its advantage is that the team can see and approve the limits before a query runs. Retention, namespaces, storage and capacity live in version control instead of appearing later as an unexpected billing line.
Collect once
Alloy gathers selected pod logs close to the workload and sends them to Loki.
Keep known limits
Retention, storage and query windows are explicit configuration.
Query existing data
Grafana, Prometheus and Loki answer bounded questions without a separate full-estate export.
Alert from the same system
Prometheus rules, Loki alerts and Alertmanager notify the people who own the response.
Recurring cost matters too
Total AWS spend later settled about 30% lower.
Before the change, CloudWatch represented nearly one quarter of normal monthly AWS spend. After moving monitoring and making several smaller resource improvements, the overall bill settled about 30% lower. Because both changes happened together, we do not attribute every percentage point to monitoring.
The comparison will differ for each environment. A small AWS estate may be cheaper and simpler to operate entirely with CloudWatch. A larger, log-heavy platform may benefit from fixed storage, deliberate retention and fewer usage-priced queries.
For a CTO, the useful question is whether the team can explain and constrain the cost of collecting, retaining and querying operational data. A cost model that depends on nobody running the wrong query is fragile.
Query the monitoring system
AI needs a narrow query interface instead of a copy of everything.
Prometheus and Loki provide established query languages and APIs. An agent can ask a narrow question in PromQL or LogQL, retrieve a bounded result and link its conclusion to the source data. Grafana gives engineers a view of the same signals.
This gives the team a useful control surface. The AI system can receive read-only credentials, access to selected clusters, fixed query windows, result limits, rate limits and a log of each request.
The agent reads from the monitoring system already responsible for collecting and retaining the data. It can prepare evidence and a report for an engineer without running a background job that repeatedly exports everything.
CloudWatch also provides APIs and access controls, and it remains a good fit for many AWS teams. The incident shows why read operations with usage-based pricing need the same attention as writes. A read can consume money, expose sensitive data and use query capacity needed during a real incident.
- Give the agent a separate read-only identity.
- Limit it to named clusters, services and data sources.
- Set maximum time windows, result sizes, rates and concurrent queries.
- Keep an audit record of the exact query and source behind each finding.
- Alert the responsible engineer when usage or scope changes unexpectedly.
- Keep production decisions and changes with the engineer who owns the response.
The practical lesson
Treat observability access as production access.
One broad read was easy to overlook in review. Repeating it about 5,760 times created a cost equal to roughly 12 normal months of AWS spend.
A monitoring platform that supports engineers and AI needs visible limits. Broad access should be difficult, repeated access measurable and abnormal behaviour loud. The team paying for it should understand the collection, retention and query paths.
That is why we prefer a monitoring stack we can operate, configure and expose through bounded interfaces. Prometheus, Loki, Grafana, Alloy, Thanos and Alertmanager give engineers a practical foundation and give AI tools a controlled way to investigate.
Start by choosing one monitoring workflow. Name its owner, narrow its data and time range, cap its rate and result size, route usage alerts and test the kill switch before leaving it to run over a weekend.
References and related resources